Top Forex Indicators Things to Know
Since indicators are such an important component of Forex trading, every technical and fundamental analyst should be familiar with the structure and applications of the most often used mt5 indicators.
-
Moving Averages (MA)
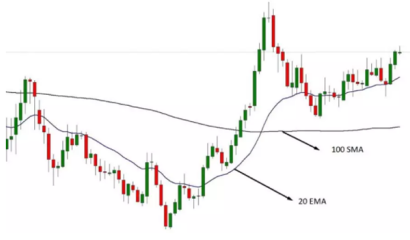
Every trader should be familiar with the concept of moving average. The currency market is driven by central banks and international corporations. As a result, it’s critical to comprehend what’s going on at the macro level.
The moving average is the average price of the previous number of candles, which represents the price’s overall emotion.
If the price is trading above the moving average, it indicates that the market is dominated by buyers. If the price is trading below the moving average, however, it indicates that sellers are in control of the market. As a result, if the price is above the moving average, you should focus your trading approach on buying trades. It is one of the most important forex indicators for a trader to understand.
In addition, the simple moving average shows the average price of the previous number of candles, which aids traders in understanding the market environment.
The exponential moving average, on the other hand, focuses on the most recent movement and assists traders in entering a trade.

-
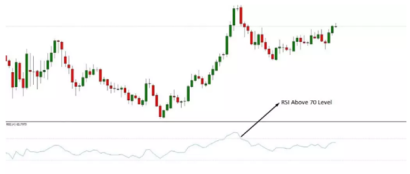
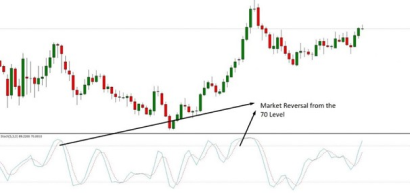
The Relative Strength Index (RSI)
The relative strength index fluctuates between 0 and 100. This indicator shows where the price is most likely to turn around
When the price climbs over the 70 levels in an uptrend, it suggests a negative market reversal. Similarly, in a downtrend, if the price falls below the 30 level, it suggests a bullish market turnaround.
-
MACD (Moving Average Convergence Diver)
A histogram and an exponential moving average make up the MACD trading indicator. The primary goal of this indicator is to calculate price divergence. The regular divergence between MACD and price suggests a market reversal, but the hidden divergence indicates that the market will continue.
It is frequently used by traders as a major indicator when developing a trading strategy. This signal, on the other hand, might be used to identify a potential market reversal or continuation point. As a result, you can use a trading strategy based on other mt5 indicators to enter the trade.
-
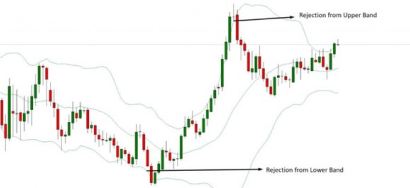
Bollinger Bands
The Bollinger Bands indicator was established by John Bollinger. Moving averages are the most important component of Bollinger bands.
On the top and downside, there are two standard deviations, with a traditional moving average in the middle.
Overall, this trading indication is simple to use and offers a secure trade entry.
Bollinger bands’ upper and lower lines serve as dynamic support and resistance levels.
Any rejection at these levels suggests the possibility of admission. In addition, any breakout from these levels might lead to successful trades.
A candle that closes below or above the middle line, on the other hand, opens the door to testing the following level.
-
Stochastic
The stochastic indicator, which was created in the early 1950s, is a prominent momentum indicator. This indicator’s primary goal is to identify the overbought and oversold zones.
Traders frequently need to include a profit-taking zone in their trading plan.
As a result, they employ this mt5 indication to determine the point at which the price is predicted to reverse. The Stochastic indicator fluctuates between 0 and 100.
If the price rises over the 70 level, it will very certainly revert. If the price falls below the 30 levels, though, a bullish reversal is possible.
-
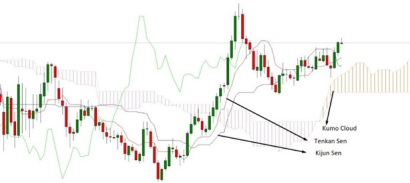
Ichimoku Kinko Hyo
The Ichimoku Cloud, also known as the Ichimoku Kinko Hyo, is a trading indicator that can be used to form a complete trading system.
This indicator contains several features that aid traders in identifying all aspects of the market.
The Kumo Cloud is the first component of this indicator that aids in market comprehension. The general trend is bearish if the price is trading below the Kumo Cloud, and bullish if the price is trading above the Kumo Cloud.
Tenkan Sen and Kijun Sen, on the other hand, are two major aspects of this indicator created using the notion of moving average. These two lines move in lockstep with the price, and any rejection from them triggers a trade.
-
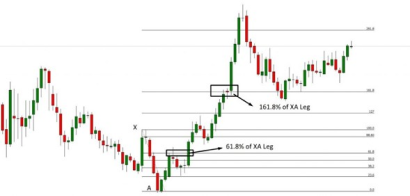
Fibonacci
Fibonacci is a trading tool that gives the most accurate market direction because it is tied to all living things.
The golden ratio of 1.618 is the most important aspect of the Fibonacci tool. Traders in the forex market use this ratio to spot market reversals and profit-taking zones.
If the price follows a trend, corrects towards the 61.8 percent Fibonacci retracement, and then reverses, the price will most likely advance to the current leg’s 161.8 percent Fibonacci extension level.
Other Fibonacci levels based on market behavior and momentum include 23.6 percent, 38.2 percent, 50.0 percent, 88.6 percent, 127.0 percent, 261.8 percent, and so on.
-
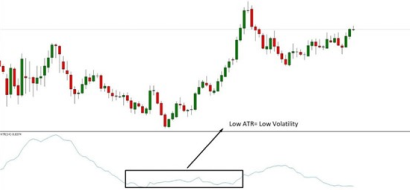
True Range Average
The volatility of a currency pair is measured by its average true range. Volatility measurement is critical in the forex market since it is linked to direct market action.
The increase of volatility in any financial market implies a market reversal, whereas the decrease of volatility indicates market continuity.
The smaller the ATR, the lower the volatility, and the higher the ATR, the higher the volatility. As a result, if the volatility is minimal, you can increase the length of your take profit. Reversal trade setups, on the other hand, might be found amid lesser volatility.
-
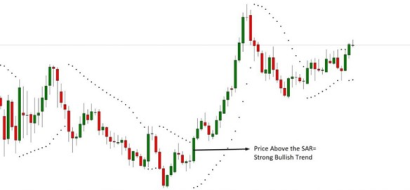
Parabola SAR
The market trend of a currency pair is indicated by the parabolic SAR. The general trend is bullish if the price is above the parabolic SAR. If the price is below the SAR, however, the general trend is negative.
Traders use this indication to identify the trend. Furthermore, a market rejection from the Parabolic SAR indicator provides a potential entry point.
-
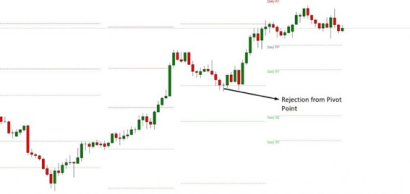
Pivot Point
The equilibrium amount of supply and demand for a currency pair is shown by pivot points. When the price reaches the pivot point, it means that the supply and demand for the given pair are equal.
When the price rises over the pivot point, it shows that there is strong demand for a currency pair. If the price falls below the pivot point, however, supply will be abundant.
Before taking any direction in the financial market, pricing tends to move to the equilibrium point. As a result, the rejection of the pivot point gives a probable trading entry for this trading indicator.
Forex indicators are crucial trading tools that all traders should be familiar with. The usefulness of a technical trading indicator, on the other hand, is determined by how you use it. To increase the likelihood of a market movement, traders frequently use many indicators, each with a particular parameter.