Historical Traces
One of the most successful ways to read price changes in the financial market is to use Japanese Candlestick charting and techniques. The approach, which is named because its resemblance to a flame, has evolved over millennia in Eastern Asia.
It was originally used in Japan, during the Edo-period (1603-1868), to monitor and forecast price movements of the country’s most prized commodity, rice; which was mostly traded at the Dojima Rice Exchange near the historical commercial capital, Osaka.
Japanese Candlestick techniques, which are based on military tactics of the period, have given traders an advantage long before bar and point and figure charts, while evolving into an appealing strategy for today’s quick and unpredictable markets.
What are the benefits of using Japanese candlesticks?
The following are three compelling reasons to employ Japanese candlesticks:
-
Dynamic visual effects. Japanese Candlesticks are more clear, visible, and attractive to the eye than other charting tools, providing an x-ray perspective of price movements and emotional health of their chosen market to anyone from a novice to a seasoned veteran. This can be used to assess how the market perceives important fundamental events.
-
Timing is everything. Japanese Candlesticks are a one-of-a-kind leading indicator that produces improved trading entry and exit timing. Reversal signals may be supplied in just a few sessions, giving it a significant advantage over other procedures that can take weeks. This is why Japanese Candlestick methods are a more appealing tactic in today’s fast-paced and volatile markets.
-
Techniques of Technical Analysis are improved. Most other Technical Analysis techniques, such as classic trend, pattern, and momentum analysis, as well as the more sophisticated Ichimoku Kinko Hyo or Demark Indicators, complement Japanese Candlesticks. This is due to the fact that candlestick charts and bar charts both employ the same four trading cycle data points: open, high, low, and close.
Price psychology and intrinsic price movement
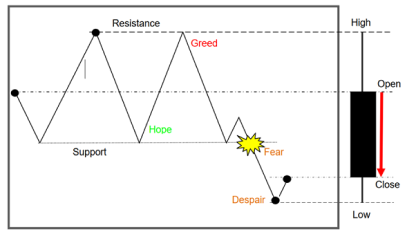
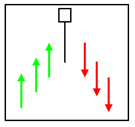
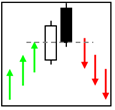
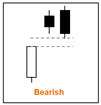
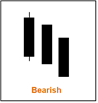
A Bearish or Black Candlestick is an illustration of intrinsic price movements and psychology that is condensed in the line chart above.
-
During the first session, the price drops, making a low, before finally rising and doubling in value. The number of purchasers in the market decreases at this extreme high point, providing a vacuum for prices to collapse and retrace to the previous low, which has become psychologically ingrained in our minds.
-
Market players are subject to a cycle of human emotions that is guided by their profit and loss performance (hope, greed and fear).
-
Assuming we are buyers, we have “hope” for a resurgence higher from support, “greed” for the second profitable run, with instinctive expectations of a new high, and, last but not least, “fear” of potentially “getting it wrong” as price fails at resistance, and “despair” of the unknown as price accelerates downward through support, eventually capitulating into uncharted territory.
Candlestick Construction
A Bearish or Black Candlestick is an illustration of intrinsic price movements and psychology that is condensed in the line chart above.
-
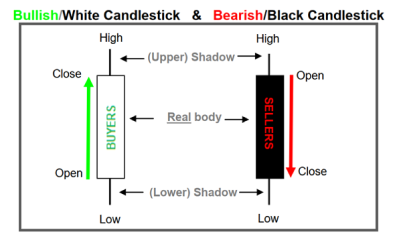
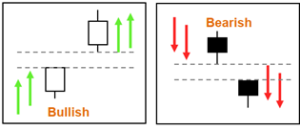
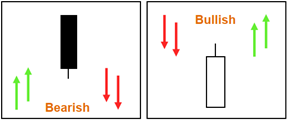
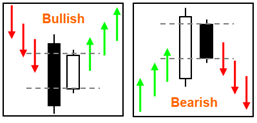
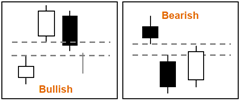
Bullish or White Candlestick: indicates that the session’s closing price was higher than the session’s opening price. This indicates that purchasers kept control and spent more time lobbying for higher prices.
-
Bearish or Black Candlestick: indicates that the session’s opening price was higher than the session’s closing price. This indicates that vendors kept control and spent more time pressing for a lower price..
-
Real Body: The “real body” is the rectangle area of the Candlestick that sits between the open and closing sessions. The “true body” symbolizes total market commitment and “essence market psychology,” as described by Japanese chartists.
-
Shadows (upper/lower): The thin lines extending out from the Bullish/White or Bearish/Black Candlestick “real bodies” are referred to as “shadows” (upper/lower) and indicate the session’s extremes. The “shadows” also reveal where momentum has been shifted.
Single Session
Two Session
Three Session
The Doji (Doji Bike)
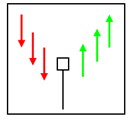
Hammer (Takuri)
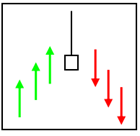
Shooting Star (Nagare Boshi)
Hanging Man (Karakasa)
High Price Gapping Play/Low Price Gapping Play
Belt Hold Line (Yorikiri)
The Doji (Doji Bike)
Signal
-
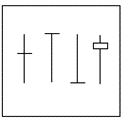
Indecisiveness, susceptibility, and uncertainty are all signals that can be neutral or cause a reversal.
Prerequisites
-
The open and close are at or close to the same level.
Consequence
-
It is crucial in spotting market tops since it is a symptom of an ambivalent market, when buyers and sellers are in a state of equilibrium. In fluctuating markets, where it is just confirming a trendless situation, it has less significance.
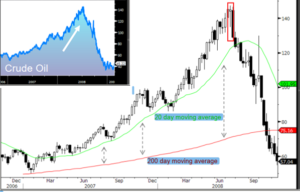
Fig 1. With both the 20 and 200 day moving averages demonstrating expanding divergence, a Doji marks the pinnacle of Crude Oil’s spectacular ascent.
Hammer (Takuri)
Signal
-
When observed in a downtrend, this represents a bullish reversal.
Prerequisites
-
Must be located in a downtrend.
-
Lower shadows are usually at least twice as long as the real body, which should be at the candle’s peak.
Consequence
-
The market appears to be “hammering out” a bottom. The lower shadow denotes a negative outcome. a price level is rejected.
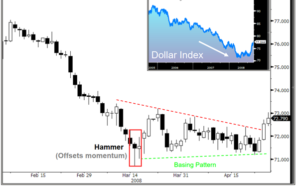
Fig 2. Following an extended drop in the Dollar trade-weighted index, Hammer makes a crucial low. Following that, a bottoming pattern appears, indicating that the market is recovering.
Shooting Star (Nagare Boshi)
Signal
-
Bearish reversal.
Prerequisites
-
It must be in an upward trend.
-
The length of the upper shadow should be at least twice that of the true body, which should be at the bottom of the candle.
Consequence
-
The engulfing indicates a transition of power between buyers and sellers, with the winner overwhelms the previous trend.
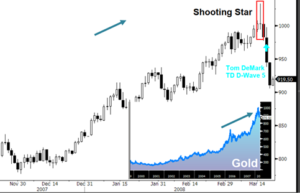
Symbolizes “trouble overhead.” The higher shadow shows a price level’s rejection to the upside. Gaps should ideally be apart from the previous genuine body, however this is not required.
Hanging Man (Karakasa)
Signal
-
Bearish reversal.
Prerequisites
-
It must be in an upward trend.
-
Lower shadows are usually at least twice as long as the real body, which should be at the candle’s peak.
-
A bearish candle must fall within 50% of the original rising session to confirm the following session.
Consequence
-
The uptrend was the driving factor, tempting a gap higher. However, sellers seize control and set an intraday low. Before the close of trading, buyers reverse the trend and push the price upward. The following session’s bearish candle confirms reversal.
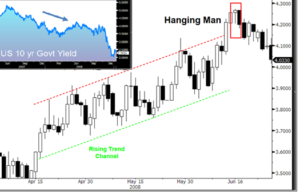
Fig 4. Following a breakthrough from a rising multi-month trend-channel, the Hanging Man signals an important top in US Long-Term Government Yields.
High Price Gapping Play/Low Price Gapping Play
Signal
-
Bullish continuation when gaps up.
-
Bearish continuation when gaps down.
Prerequisites
-
Price action is congested near its highs (high price gapping) or lows (low price gapping), stabilizing the prevailing trend, and then gapping farther in the existing trend’s direction.
-
Second real body (open & close) engulfs prior session’s real body, not necessarily the shadow.
Consequence
-
The gap is described as a move out, either up or down, that continues the trend’s direction. It is the ability to break free from a restraint period that has been imposed.
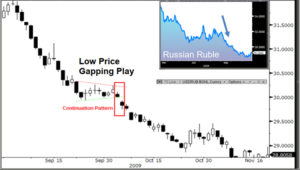
Fig 5. The Russian Ruble is in a significant downward trend on the chart. Price took a brief halt here to gather momentum. Price gaps down after breaking through the support line that defines the bottom of the consolidation period, beginning the current bearish trend with increased vigour.
Belt Hold Line (Yorikiri)
Signal
-
After a downtrend, a bullish belt hold opens on the low and closes at or around the top of the candle.
-
After a previous upswing, a bearish belt hold opens on high and finishes at or around low of candle.
Prerequisites
-
The body must be the opposite colour of the current trend.
-
There must be a considerable gap, no shadow at open and a markedly long body.
Consequence
-
Most essential if they are preceded by a prevailing trend and confirm resistance on the next day’s close. Yorikiri is a Japanese sumo wrestling phrase that means “push your opponent out of the ring while holding on to his belt.”
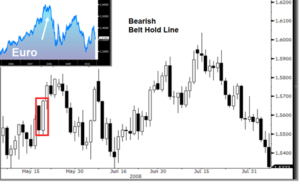
Fig 6 The euro opened sharply higher than the previous day’s close, then retreated for the remainder of the day, closing on a lengthy bearish candle.
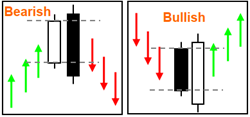
Engulfing (Tsutsumi)
Harami (Harami)
Piercing Line (Kirikomi)
Dark Cloud Cover (Kabuse)
Tweezer Top/Tweezer Bottom
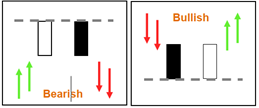
Engulfing (Tsutsumi)
Signal
-
Bearish reversal when found in an uptrend.
-
Bullish reversal when found in a downtrend.
Prerequisites
-
Important to be located within respective trend (see above).
-
Second real body (open & close) engulfs prior session’s real body, not necessarily the shadow.
-
For bullish engulfing, the second candle must be white, whereas for bearish engulfing, the second candle must be black.
Consequence
-
The engulfing indicates a transition of power between buyers and sellers, with the winner overwhelms the previous trend.
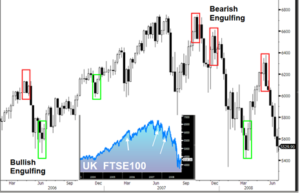
Fig 7. A sequence of (Bearish/Bullish) Engulfing signals on the UK’s FTSE Stock Market at key swing points.
Harami (Harami)
Signal
-
Bullish reversal when found in a downtrend.
-
Bearish reversal when found in an uptrend.
Prerequisites
-
They must fit with their distinct trends.
-
The second real body is small and is confined within the real body from the previous session.
Consequence
-
The dominant force is losing support and may be shifting in the wrong direction. The tendency is reversed when a pregnant or mother candle gives birth to a little candle.
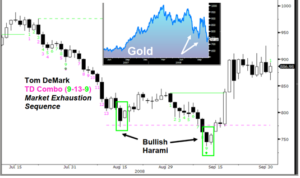
Fig 8. Harami uses Tom DeMark’s TD-Combo signal to cut out crucial lows within an extreme market exhaustion cycle (9-13-9).
Piercing Line (Kirikomi)
Signal
-
Bullish reversal.
Prerequisites
-
It must be in a downward trend.
-
At the end of a downturn, there is a long bearish candle. The following session begins with a lower opening and subsequently reverses to a higher opening, all within 50% of the previous session’s true body.
Consequence
-
The primary driver was the downtrend, which enticed prices to gap lower. However, there is a good reversal before the end of trading, which compensates the recent decrease. Sellers are left with doubts about their position.
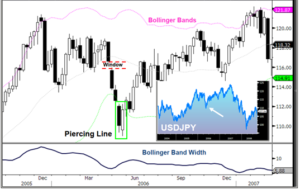
Fig 9. After a steep decrease that temporarily punctures the lower Bollinger Band, the bullish piercing line candle pattern reclaims control.
Dark Cloud Cover (Kabuse)
Signal
-
Bearish reversal.
Prerequisites
-
It has to be in an upward trend.
-
The end of the uptrend is marked by a long bullish candle. The subsequent session begins higher and eventually lower, with the real body remaining within 50% of the previous session’s.
Consequence
-
The primary driver was the uptrend, which enticed prices to gap higher. However, there is a negative reversal before the end of trading, which cancels out the recent advance. Those who have been waiting for a chance to participate can finally do so.
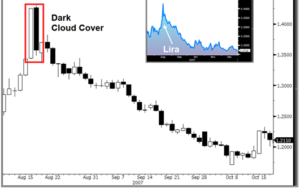
Fig 10. At the apex of a rally and the start of a downward trend, the Dark Cloud Cover pattern appears.
Tweezer Top/Tweezer Bottom
Signal
-
A tweezer bottom indicates a bullish reversal in the short term.
-
Tweezer tops indicate a bearish reversal in the short term.
Prerequisites
-
Two days in a row in which the high and low temperatures are the same. The candle’s colour is unimportant, and the tweezers can be made up of real bodies, shadows, and/or doji. Long first body, little second actual body is ideal.
-
Two successive highs or lows indicate the presence of support or resistance. In the second session, whatever force the market had in the first session is dissipating. In weekly/monthly charts, this is a particularly prominent pattern.
Consequence
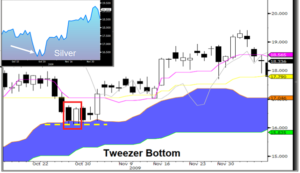
Fig 11. Just above the upper border of the Ichimoku cloud, the silver future makes a Tweezer Bottom, signalling a bullish reversal. Price then goes through both the Base and Conversion Lines, indicating a significant upward tilt.
Morning Star (Sankawa Ake No Myojyo)
Evening Star (Sankawa Yoi No Myojyo)
Upside-Gap Two Crows
Three White Soldiers
Three Black Crows
Tasuki Gap
Gapping Side-by-Side White Lines
Advance Block
Abandoned Baby
Rising Three Method/Falling Three Method
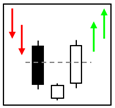
Morning Star (Sankawa Ake No Myojyo)
Signal
-
Bullish reversal.
Prerequisites
-
Must be located within a downtrend.
-
At the end of a downturn, a long bearish candle appears.
-
The next session has a limited range and likely to be lower. The next candle is a bullish long candle that rallies more than 50% of the previous bearish candle.
Consequence
-
The main motivator was the downward trend, which encouraged prices to drop. The brief session that follows, on the other hand, foreshadows a potential shift in opinion. In astrology, Mercury, the Morning Star Planet, appears before sunrise. Finally, the third session confirms the results of the prior two sessions and raises the bar.
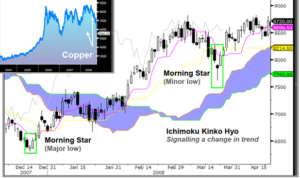
Fig 12. Copper has morning star reversals at major and minor lows, with Ichimoku Kinko Hyo signaling a trend change.
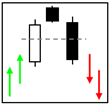
Evening Star (Sankawa Yoi No Myojyo)
Signal
-
When detected in an uptrend, this is a bearish reversal indicator.
Prerequisites
-
Must be located within an uptrend.
-
At the top of the upswing, there is a long bullish candle. The next session has a small range and has a tendency to gap higher. A bearish long candle follows, followed by a bearish short candle.
Consequence
-
The primary driver was the uptrend, which enticed prices to gap higher. The following brief session, on the other hand, foreshadows a possible shift in attitude. The evening star planet “Venus” appears in astrology before nightfall. Finally, the third session verifies the second and drives the price lower.
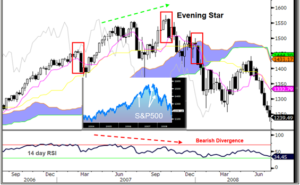
Fig 13. During the top formation on the S&P500 Index, there were a series of evening star reversals. As upside momentum weakens, the RSI momentum indicator confirms bearish divergence on the lower axis.
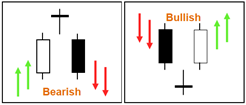
Upside-Gap Two Crows
Signal
-
A bearish pattern indicates a reversal to the upward.
Prerequisites
-
The first session begins with a long white candle, followed by a gaped-up black body. A third black flame, which engulfs the first day’s body, completes the pattern.
Consequence
-
The market is on an uptrend and has recently gapped up to a new all-time high. The market fails to maintain its position and is followed by two dark bodies that grow in length. The sellers gradually gain control. If price does not restore strength in the fourth session, the downside may prevail.
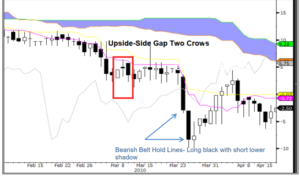
Fig 14. The upside gap two crows in the US 10-year swap spreads foreshadows an impending dip, which materializes only one week later in the shape of two consecutive bearish candlesticks, confirming the upside exhaustion.
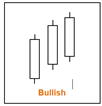
Three White Soldiers
Signal
-
After a downtrend or range-bound market, a bullish pattern signals strength.
Prerequisites
-
Three consecutive sessions of long white candlesticks, each closing at or near previous high. Each candle begins at or near the range of the body of the previous.
Consequence
-
Three long white candlestick sessions in a row, each closing at or around the preceding high. Each candle starts at or near the range of the previous candle’s body.
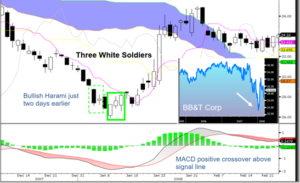
Fig 15. With a bullish harami, BB&T initially predicts a reversal of the prior downtrend (small white, following an engulfing white). Following that, a three white soldier pattern appears, signalling a shift in momentum to the upside, which is further reinforced by a positive MACD crossover.
Three Black Crows
Signal
-
Market correction is indicated by a bearish pattern.
Prerequisites
-
Three sessions of extended black candlesticks, each closing lower than the preceding and all at or near lows. Consecutive candles start inside the range of the previous candle’s body.
-
Second real body (open & close) engulfs prior session’s real body, not necessarily the shadow.
Consequence
-
The Three Black Crows pattern suggests a shift in selling pressure to the downside. The bodies are long and the shadows are little. The pattern is best suited for long-term traders who will wait for all three to complete to confirm a market correction.
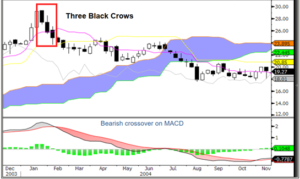
Fig 15. With a bullish harami, BB&T signals the conclusion of the previous downtrend (small white, following an engulfing white). Following that, a three white soldier pattern appears, signaling a shift in momentum to the upside, which is supported by another strong MACD crossover.
Tasuki Gap
Signal
-
When tasuki gaps up, bullish continuation is likely.
-
When tasuki gaps down, bearish continuation is likely.
Prerequisites
-
A bullish tasuki gaps up, then one white and one black candle, preferably of equal size, follows. The second black candle ignites within the physical body and then extinguishes below. A bearish tasuki gap is the polar opposite.
Consequence
-
In the third session, the gap does not close completely, indicating that the current trend will continue. If the gap is filled, however, support or resistance has been breached, and the optimistic or bearish mood has been nullified.
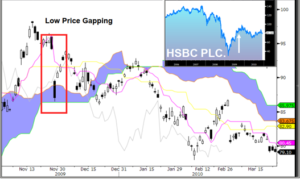
Fig 17. Price surges down towards the ichimoku cloud, attempting to break through, then pulls back with a sequence of white candlesticks filling the previous session’s gap in the chart above.
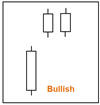
Gapping Side-by-Side White Lines
Signal
-
Pattern of bullish continuance.
Prerequisites
-
The first session is usually marked by a long white candlestick, which is followed by an open above the previous candlestick’s closing. The size of the second and third sessions is comparable, and both are white.
-
The gap between the first and second sessions is not closed by the end of the third session.
Consequence
-
In an upward trend, this pattern is the most important. This pattern indicates a continuance of the bullish bias in an already bullish situation.
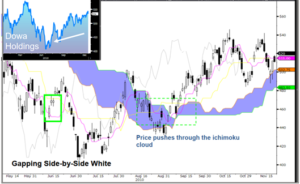
Fig 18. In a sustained bear trend, the IBEX breaks through the ichimoku cloud, pauses for three short white inside bars, and then resumes on strong volume and extended black bodies.
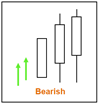
Advance Block
Signal
-
At the top of a clear uptrend, a bearish reversal signal arises.
Prerequisites
-
Three white candlesticks like three white soldiers, except the advancing block is always up trending.
-
The second and third sessions have extended upper shadows and open within the body of the previous session.
Consequence
-
Each succeeding bull candle is weaker than the preceding, indicating that the previous upswing is losing momentum. The market is attempting unsustainable highs, and the shadows indicate a lack of position strength.
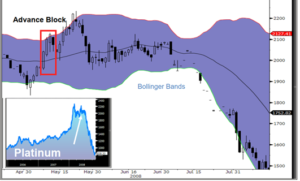
Fig 19. Platinum is struggling to achieve new highs as the uptrend comes to an end. Each candle opens within the body of the previous candle and shuts on progressively shorter body lengths. The failure swing on the upper Bollinger band confirms that a top has been formed and that a reversal is on the way.
Abandoned Baby
Signal
-
In a downturn, a bullish reversal can be seen.
-
When observed in an uptrend, this represents a bearish reversal.
Prerequisites
-
They must fit with their distinct trends.
-
The second session is a doji that gaps in the trend’s direction, followed by a third session that gaps in the opposite direction of the first.
Consequence
-
In one final try, trend strength gaps, but a rapid change in momentum pulls price in the opposite direction.
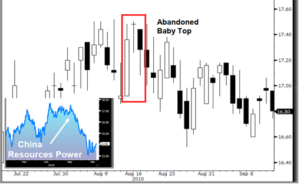
Fig 20. In one final try, trend strength gaps, but a rapid change in momentum pulls price in the opposite direction.
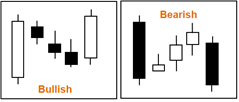
Rising Three Method/Falling Three Method
Signal
-
When “rising,” continue to be bullish.
-
When “falling,” bearish continuation is expected.
Prerequisites
-
The first session is in the trend’s direction, followed by a series of 2-3 short-bodied sessions, ideally trading in the opposite direction of the trend, inside the first candle’s high-to-low range. Finally, a long body workout restores the previous trend’s orientation.
Consequence
-
Three Method is seen as a break from trading and combat. In Western chart patterns, it’s similar to a flag or pennant configuration. The first and last candlesticks should have the most volume.
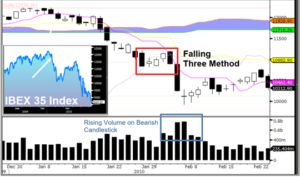
Fig 21. In a sustained bear trend, the IBEX breaks through the ichimoku cloud, pauses for three short white inside bars, and then resumes on strong volume and extended black bodies.
FAQ
1. How do you determine whether a candle is bullish or bearish?
2. What significance does the candlestick’s “true body” and shadow have?
3. What key principles should be used to confirm a candlestick signal?
4. What are the finest candlestick timeframes to use?
5. What are the differences in candlesticks between markets?
6. To confirm candlestick signals, which indicators should be used?
7. When it comes to candlestick signs, how reliable are they?
